
Staffing BI dashboards exist in almost every firm. Reports get generated, data gets pulled, and somewhere there is a chart nobody checks anymore. The problem is not the absence of data. It is that your dashboards were designed around what was easy to pull, not around the questions you actually need answered.
The symptoms look like other problems entirely. Leadership asks for a pipeline update and someone pulls a manual export. Finance wants commission totals and reconciliation takes two days. An ops decision gets made based on a manager’s read of the room rather than actual throughput data. None of that feels like a BI problem in the moment.
But in most cases your data already exists. What is missing is a reporting layer built to surface it in a way that actually connects to the decisions you are making.
Why Most Staffing BI Dashboards Do Not Drive Decisions
Staffing BI dashboards fail for the same reason in most firms: they were built at implementation and never redesigned around how decisions actually get made.
- Most dashboards are built at implementation, configured around available data fields rather than operational questions
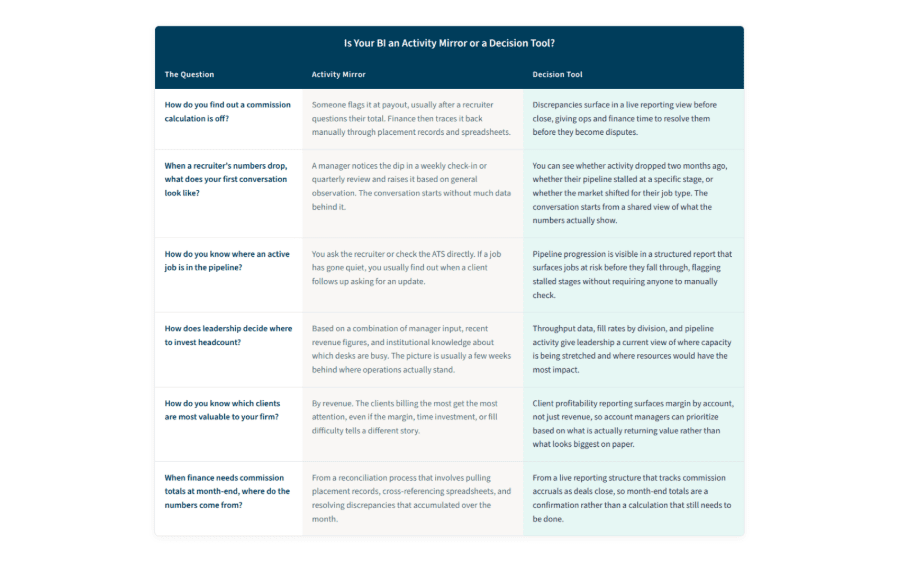
- They function as activity mirrors: confirming what already happened rather than pointing to what needs to happen next
- Leadership learns to work around them, defaulting to manager input, spreadsheet exports, or verbal updates instead
- Over time, the dashboard gets checked less frequently, maintained less carefully, and trusted less completely
- 77 percent of business leaders say the dashboards and charts they receive do not always relate directly to the decisions they need to make1
The result is dashboard fatigue: not from too much data, but from data that does not answer the right questions.
The Questions Your Staffing BI Dashboards Should Be Able to Answer
Staffing BI dashboards earn their place in daily operations when they answer the specific questions your team is asking every single week.
Read More: Beyond Basic Bullhorn: How Advanced Workflow Automation Transforms Staffing Operations
Commissions and Finance Visibility
Staffing BI dashboards built around commissions visibility give ops and finance leaders the real-time view they need to catch disputes before they reach payout. Can finance verify payout totals without a manual reconciliation process? If those answers require a spreadsheet or a separate export, the BI layer is not doing its job.
Commission accuracy depends on data that is already in your system. The missing piece is a reporting structure built to surface it consistently, so disputes get caught before they reach payout rather than after.
Operational Performance and Pipeline Health
Where are jobs stalling? Which recruiters are pacing ahead of target and which are two weeks behind without anyone catching it? Pipeline progression and recruiter productivity data exist inside most ATS platforms, but without a structured reporting view, ops leaders end up managing by instinct rather than by what the system is already capturing.
The right BI layer surfaces these answers without requiring someone to manually pull and interpret raw data before every weekly standup.
Leadership and Resource Decisions
Headcount decisions, desk assignments, and client prioritization should be informed by actual throughput data, not the most recent manager update. When leadership cannot see an accurate picture of pipeline activity, fill rates by division, or margin trends by client, resource decisions lag behind where operations actually stand.
Staffing BI dashboards built around leadership questions close the gap between what the firm is doing and what leadership believes it is doing.
Client Profitability and Account Health
Revenue by client is easy to track. Margin by client is where most reporting falls short. Which accounts are generating strong gross margin and which are consuming recruiter time without returning proportional value? Without BI structured around those questions, account managers prioritize by gut feel or relationship history rather than actual performance data.
A dashboard built around client profitability gives leadership the visibility to make smarter decisions about where to invest resources and which accounts need a different approach.
What Changes When Dashboards Are Built Around Questions
Staffing BI dashboards designed around operational questions behave differently from the ones most firms are currently ignoring.
- Reports built around specific operational questions get used because they answer something the reader actually needs to know
- Commissions, pipeline, and performance data become verifiable rather than disputed, reducing reconciliation time and increasing trust
- Leadership stops waiting for manager summaries and starts making resource decisions from a shared, reliable view
- 72 percent of business leaders admit that data volume and lack of trust in data has stopped them from making any decision at all.1 When your BI is designed well, it removes that paralysis rather than adding to it
- You move from reporting on the past to operating from a clear picture of the present
Find Out What Your Dashboards Are Missing
Most staffing firms do not have a data problem. They have a design problem. Newbury Partners builds BI dashboards around the questions staffing leaders actually need answered, whether that is commission visibility, operational performance, or client profitability.
The BI Portal delivers pre-built, staffing-specific dashboards that are ready to use from day one. Contact us to find out what your current reporting setup is leaving on the table.
Reference
1. “Global Study: 70% of Business Leaders Would Prefer a Robot to Make Their Decisions.” PR Newswire, Oracle, 19 Apr. 2023, www.prnewswire.com/news-releases/global-study-70-of-business-leaders-would-prefer-a-robot-to-make-their-decisions-301799591.html.